👀 WEEKLY SUMMARY 24.2-28.2 / FORECAST
📉 S&P500 – 7th week of the base cycle (average of 20 weeks), 2nd phase. The February 24 pivot forecast attempted to slow down the bearish momentum from the triple top at the December 9 and January 29 extreme forecast levels, but its energy lasted only through Tuesday and Wednesday. The market reversed on Friday from the strong 5850 level, formed in November last year at the October 14 and November 18 extreme forecasts. Based on cycle timing and the chart, the situation resembles the completion of the 1st phase of a bearish base cycle.
👉 Strong-handed position traders with stops above the now triple-top level should have held their short position from January 24. The current futures price has not broken above it. Those who didn’t hold, I hope you opened a short position from the third top on February 20. The next extreme forecast is March 3.
⚠️ The retrograde Venus period begins, which I wrote about in early December. The start of retrograde Venus typically brings a market correction, while retrograde Mercury will add volatility from March 17. A great period for short-term trading. Retrograde Venus usually has a one-week lag, which would place it around March 10.
⚠️ This base cycle is likely to be bearish, with a short rise and a steep drop below the opening. I predicted this in early January. NASDAQ has already broken below the base cycle opening level. The market remains under the weight of two overextended long cycles, which I have written about extensively in past posts. These long cycles will complete in the current base cycle. However, I do not expect a correction to exceed 20-25%, as a major crash is unlikely before summer this year or spring next year.
🏆 GOLD – 16th week of the base cycle (15-20+ weeks). The February 24 pivot forecast turned gold downward, marking the top of the current base cycle and forming a double top with the February 11 pivot forecast. By Friday’s close, gold hit the first support at 2850 (see chart). We are in the final stage of the base cycle, but the pattern does not yet resemble a cycle completion.
👉 The price movement from the January 29 extreme forecast to the February 11 or February 24 extreme highs provided over $15K per contract on GC futures. Those who entered, congratulations on an excellent trade. A short position was opened at the February 24 pivot forecast.
👉 Strong support is at the October 28 extreme forecast level (2850-2830 on the current futures contract). This level needs to be broken. The next support is the broken double top at the previous retrograde Mercury level from November 25 (2780 on the current futures contract).
⚠️ The next extreme forecast is March 3 – the beginning of the retrograde Venus period, which I wrote about in early December. I am not sure if this extreme forecast will start a new cycle. A strong extreme forecast within the timing of the base cycle’s completion falls on the start of retrograde Mercury on March 17 (week 18 of the cycle).
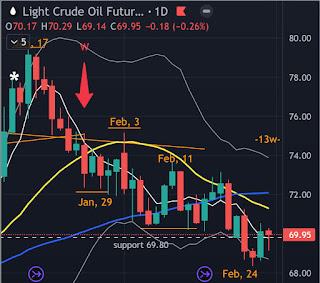
🛢 CRUDE – 13th week of the base cycle (28 weeks), mature 1st phase. The February 24 pivot forecast reversed crude from the strong 69.80 support level. This level was broken and eroded during the week, as I predicted last time. Based on timing and the chart, there are signs of the second phase beginning. In this context, I closed my short position from February 3. The price movement from the February 3 extreme forecast on CL futures provided $2K per contract.
⚠️ I maintain my bearish stance, which I explained in my crude oil post from summer 2024. The next extreme forecast is March 3. Another extreme forecast is on March 19, combined with retrograde Mercury on March 17.
Content Hub - Articles Index - Library / Archive
#stocks #gold #crude


Comments
Post a Comment