Posts

Showing posts from August, 2024

💥 OIL CRISIS OF 1973

Image
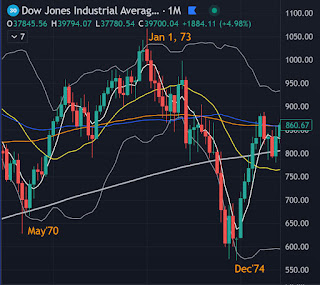
Astrology 🔸 7-year crisis cycle 🔸 Aspect of Jupiter and Uranus in January 1973 🔸 Aspect of the end of the crisis in January 1975 Cycles 🔸 4-year cycle of the US stock market from May 1970 to December 1974. Events 🔸 The crisis formally began in October 1973. Arab countries declared an oil embargo due to the support of Israel by the United States and its allies. 🔸 Oil prices jumped threefold. The recession lasted for 16 months. The embargo was lifted in March 1974. Over the year and a half of the crisis, US GDP fell by 3.2%. The hallmark of the crisis was stagflation - a combination of economic recession and unemployment with rising prices. 🔸 The stock market crash began in January 1973 and ended in December 1974. The DJIA value at its maximum was 1067, at its minimum 570. The amplitude was approximately 46%. Results 🔸 The market crash was expected according to the 7-year crisis cycle . 🔸 The January 1973 top fell exactly in the middle of the 4-year cycle . 🔸 The mar...

👀 WEEKLY RESULTS 19.8-23.8 / FORECAST

Image
📉 S&P500 - 3rd week of the basic cycle (20 weeks). The planetary tornado of August 19, promised at the beginning of the year (https://t.me/jointradeview/11), held back the pressure of the new cycle all week, which began on August 5 at Mercury retrograde (https://t.me/jointradeview/116). S&P has not yet reached the level of the previous top on Algol from July 15 (https://t.me/jointradeview/161) either by index or by futures. 👉 This week, the trend prospects depend on a breakout of the resistance level or the formation of a double top. Last week (https://t.me/jointradeview/197) we wrote: "☝️ For now, we are acting according to game plan 2 (https://t.me/jointradeview/183), but we remember about the tendency of retrograde Mercury to various tricks (https://t.me/jointradeview/146). A strong extreme forecast is lurking on September 3. This means that we can twitch for a couple of weeks until the end of retrograde." 👉 We are twitching, waiting for the formation. Taking in...

🪐 RESET CYCLE - RUSSIAN ROULETTE

Image
☝️ For at least the last 150 years, 36-year cycles of Saturn and Neptune conjunctions have had a significant impact on the regime that operated in the territory of modern Russia. 🔸 The last conjunction of these two planets took place in 1989 and coincided with the fall of the Berlin Wall and the subsequent collapse of the USSR. 🔸 Before that, Saturn and Neptune were connected in 1952-1953. The main event during this period was the death of Stalin on March 5, 1953. 🔸 The overthrow of the monarchy as a result of the February Revolution of 1917 and the seizure of power by the Bolsheviks in October of the same year also occurred during the 36-year conjunction of Saturn and Neptune. 🔸 Even earlier, these planets were connected in 1882. A year before, Tsar Alexander II was assassinated by the Narodnaya Volya. 🔸 The next conjunction of Saturn and Neptune will occur in February 2026. Content Hub - Articles Index - Library / Archive #russia

👀 WEEKLY RESULTS 12.8-16.8 / FORECAST

Image
📉 S&P500 - 2nd week of the new base cycle (20 weeks). The new cycle began on Mercury retrograde (https://t.me/jointradeview/116), which turned the stock markets around on August 5. Ahead is the resistance of the previous top on Algol from July 15 (https://t.me/jointradeview/161) and the planetary tornado on August 19, which we promised at the beginning of the year (https://t.me/jointradeview/11). There is also a divergence in MACD to boot. All the conditions for a potential double top. ⚠️ Given the astrological weight of the upcoming extreme forecast on August 19 and the general cyclical timing (https://t.me/jointradeview/187) involving a 4-year and 50-week cycle, I assume that this base cycle will be bearish ending in the fall-winter of 2024. ☝️ For now, we are acting according to game plan 2 (https://t.me/jointradeview/183), but remember about the tendency of retrograde Mercury to various tricks (https://t.me/jointradeview/146). A strong extreme forecast is lurking on Septemb...

🏆 ILLUSIONS OF GOLD BUGS

Image
🔸 Yesterday on Smartlab, for once, I got a couple of comments. In connection with my last post about gold . "...the price of gold has never had any limits and never will." "If I had been 25 years old in 1980 and had bought gold, I would have at least survived the collapse of the USSR (only gold and real estate could save money back then), and by the age of 46 I would definitely not have lost rubles." In the investment world, such people are called "gold bugs". How right are they that they pine over gold? Look at the gold charts for the periods 1980-2001 and 2011-2015. 🐻 In 1980, gold cost $700-800. In 1991, gold was worth $340. By 2001, gold had fallen to $250. It didn't return to the 1980 level until 2008. Not the best investment. 🔸 If someone aged 25 had invested in gold in 1980 "all the way", they would have been broke by the age of 45. It was an epic 20-year bear with an amplitude of 60%. The investment would have returned to 0 only 30...

👀 WEEKLY RESULTS 5.8-9.8 / FORECAST

Image
📈 S&P500 - 17th week of the base cycle (20 weeks) or possibly the 1st week of a new base cycle. Retrograde Mercury worked again clearly, (https://t.me/jointradeview/116) turning the markets around on August 5 at the second support. The amplitude of movement in the S&P from Algol (https://t.me/jointradeview/161) to retro-Mercury was 10%. Our forecasts were fully realized. ⚠️ Perhaps August 5 became the basis of a 16-week base cycle, and we are in the first week of a new base cycle. Given the astrological weight of the upcoming extreme forecast on August 19 and the general cyclical timing (https://t.me/jointradeview/187) involving a 4-year and 50-week cycle, I assume that this base cycle will be bearish ending in the fall-winter of 2024. ✋ For now, we are acting according to game plan 2, (https://t.me/jointradeview/183) but remember the tendency of retro-Mercury to various tricks. (https://t.me/jointradeview/146) In addition, a strong extreme forecast is lurking on September ...

📈 50-WEEK CYCLE, US STOCKS

Image
☝️ In February, March and May I mentioned a 50-week cycle that started in October 2023. The normal range for this cycle is 40-60 weeks (75%). The length of the previous cycle after the low in October 2022 was 54 weeks. The 50-week mark of the current cycle is in October 2024. 👉 Almost always, the 50-week cycle rises for at least 7 weeks after the start. In 90% of cases, the rise lasted at least 10 weeks. ☝️ When aligned with a 4-year cycle, the last leg of a 50-week DJIA cycle often tests or breaks the low of the previous 50-week cycle (75%). Since we are at the end of a 4-year cycle , there is a chance that in the fall of 2024, the DJIA could touch or break the 32400 level. 👉 Most 4-year cycles consist of four or five 50-week cycles. The current cycle is the fourth. The cycle is mature. Therefore, the bottom of the current 50-week cycle may coincide with the bottom of the current 4-year cycle. ⚠️ As I wrote in my May post on the US equity market medium-term cycle , the common low of...

👀 WEEKLY RESULTS 29.7-2.8 / FORECAST

Image
📈 S&P500 - 16th week of the base cycle (20 weeks). Of course, I knew that Algol (https://t.me/jointradeview/161) 😈 would put pressure on the market on July 15, I warned about this event (https://t.me/jointradeview/20) at the beginning of the year and closed part of the position on this aspect (https://t.me/jointradeview/171), but I considered such a powerful blow with a breakout of all support levels unlikely (although I pulled up the stop 😁). The remaining half of the position from April 22 was closed by stop (https://t.me/jointradeview/176) with a very good profit. ⚠️ On Monday, an important extreme - the first day of Mercury retrograde (https://t.me/jointradeview/116). Technically, the 3rd Fibonacci level of 0.618 and strong support are ahead. The scenario is April (https://t.me/jointradeview/54), but we need to clarify the previous game plan (https://t.me/jointradeview/155), options: 1️⃣ Bearish 3rd phase and the bottom of the base cycle at our extreme forecast on August 19....

💥 STOCK PANIC OF 1857

Image
🔹 The Panic of 1857 was a financial crisis that swept the United States from 1857 to 1861, considered the first global crisis. 🔹 The United States had been booming for the previous decade. Vast resources, the gold rush attracted hundreds of thousands of prospectors. The telegraph radically changed business communication. Railroads changed logistics. 🔹 The financial downturn of 1857 began when panic swept Great Britain, one of the United States' main trading partners. Parliament refused to back money with gold and silver. Investors became alarmed and began dumping stocks. 🔹 After the bankruptcy of a large American grain and flour company in the summer of 1857, investors began selling stocks in New York. This was followed by a run on banks due to the bankruptcy of a large financial company. Then followed a dumping of all papers, especially railways. Many railways stopped. 🔹 Without railway communication, production began to decline, mainly cast iron and fabrics. In Great Britain...