👀 WEEKLY SUMMARY 23.9-27.9 / FORECAST
📉 S&P500 - 8th week of the base cycle (20 weeks on average). Despite the fact that S&P and DJIA have broken through all the important resistance levels, the market is technically weak. NASDAQ is lagging far behind and has not yet even come close to the Algol level. I believe that it is too early to revise the bearish potential of the current base cycle.
👉 The extreme forecast for September 20-23 seriously slowed down the growth of the markets at the beginning of the week and brought bearish sentiment in the second half of the week. In this situation, a delayed effect is possible. Technically, all three indices look very overbought. The next extreme forecast is October 11-14.
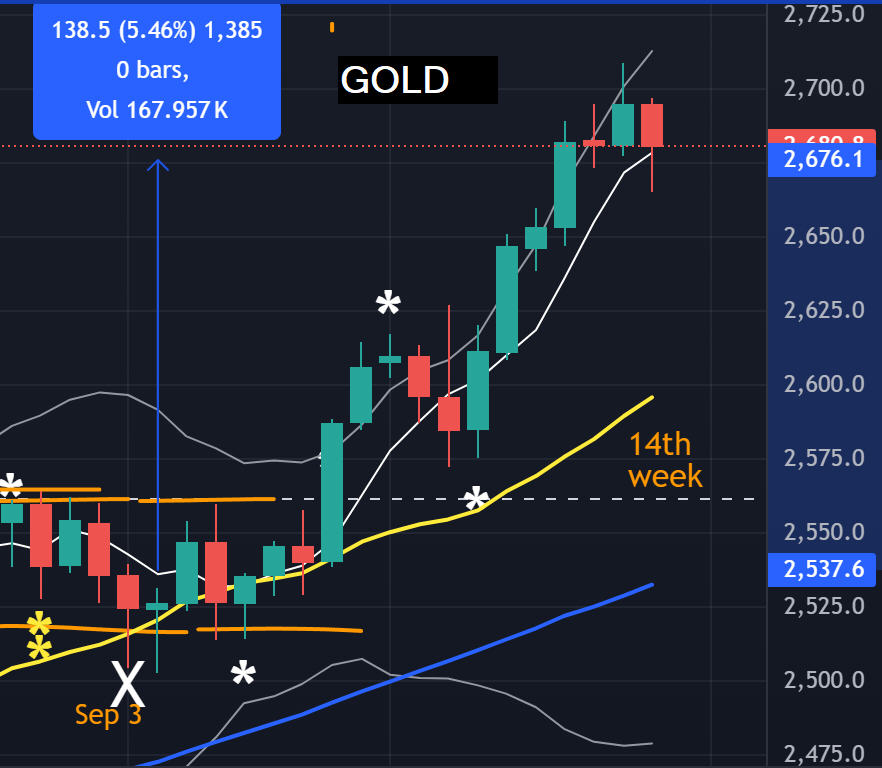
🏆 GOLD - Week 14 of the base cycle (15-20+ weeks). The base cycle is close to maturity. The probability of a correction is increasing. As expected, the weak extreme forecast for gold on September 23 did not affect the trend, although a delayed effect cannot be ruled out. It may still work out this week. The next extreme forecast is October 11-14.
💰 The position opened on the extreme forecast on September 3 (was made at the beginning of the year), was closed by stop on Friday. The profit was about 14K per contract (see chart).
🛢 CRUDE - Week 17 of the base cycle (28 weeks), Phase 2. Note how beautifully our extreme forecast on September 23 worked out (see chart). Crude has bounced off the lower border of the triangle perfectly, both in timing and technique. The next extreme forecast for crude is October 14. The concept is the same, see the post from September 9. My bearish sentiment for crude remains.
💸 DOLLAR-YEN - the 8th week of the basic cycle (25 weeks on average), which began on August 5 at the forecast retro-Mercury. The market maintains bearish signs. The promised correction has ended and this week there will be a second attempt to break through the level of the beginning of the cycle from August 5. If we break through, this could be a serious bear. The USD/JPY pair is at the end of a 4-year cycle, which could be very intense (see chart in the April post).


Comments
Post a Comment